 Collaborators: Robert Marc, PhD, Bryan Jones, PhD
Department: Ophthalmology, Moran Eye Center
Project
We are currently engaged in annotating the worlds first complete connectome with all the resolution and molecular profiling required to elucidate connectivity and network function. We are dedicated to making our research data so accessible that it becomes a standard for connectomics research methodology, data sharing, and visualization. There has been slow but continued interest from external groups in using our connectome computational platform. Many of the computational tools and algorithms for our connectome effort were originally developed at the SCI Institute. Collaborators at Brandeis University recently published a paper using a volume constructed with our assistance. Japan Electron Optics Limited (JEOL) requested a demonstration of the tools’ ability to build semiconductor mosaics. We also are sharing data with a modeling collaboration involving Gianluca Lazzi and Chris Johnson. We recently made our Python volume manager “Nornir” available online. Nornir takes input from supported microscopy platforms, currently SerialEM or Surveyor and produces 2D or 3D volumes with the output posted to a website. We have also developed a Python package to directly access our annotation data. After our data is online and well visualized it will provide extensive instances of high-quality ground-truth data for research ranging from n image segmentation to graph visualization to neural modeling. Neuroscientists also have a considerable interest in these data. While the coarse outlines of retinal and other brain networks have long been known, no network has had the potential of being mapped completely until retinal connectome RC1 was built. All other connectomes lack the resolution, molecular tagging and scale of RC1. It is the model for all future connectomes.
BIDAC Contact: Josh Cates, Liz Jurrus
BIDAC Expertise
- Full 3D model: Create a renderer capable of handling a full 3D model of our retina, in order to optimize 3D model generation and sharing these models online.
- Graph visualization for complex directed graphs with hundreds of nodes and thousands of edges representing networks from connectome RC1. These networks are far more complex than the neuroscience community anticipated and are described by directed network graphs that are impossible to infer or predict. With developer resources we can improve graph visualizations to suggest the most significant nodes and connections.
Progress
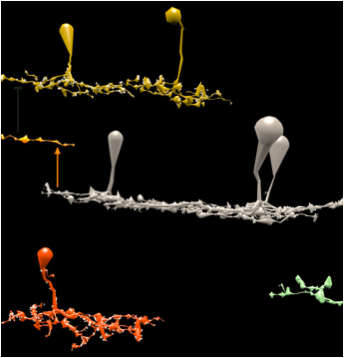
We developed a user-friendly application VikingView enabling fast 3D visualization of retina neural circuitry, with input data being directly accessed via a large database.
General contribution
This software visualization solution help improve the understanding of the retina system, more complex than the neuroscience community anticipated.
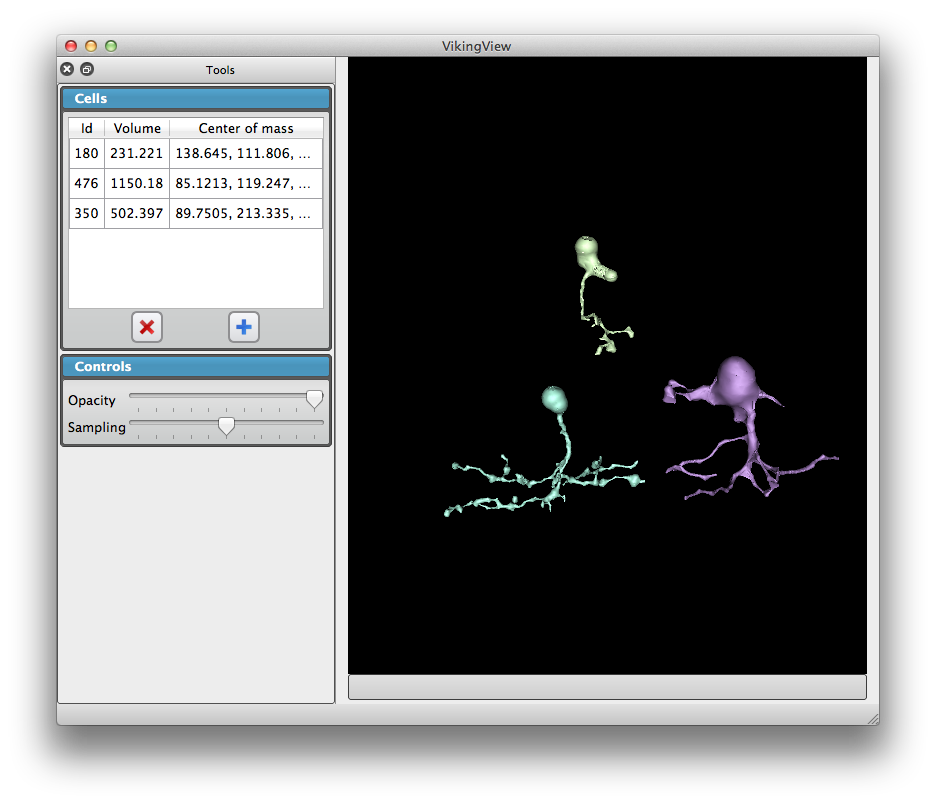 |
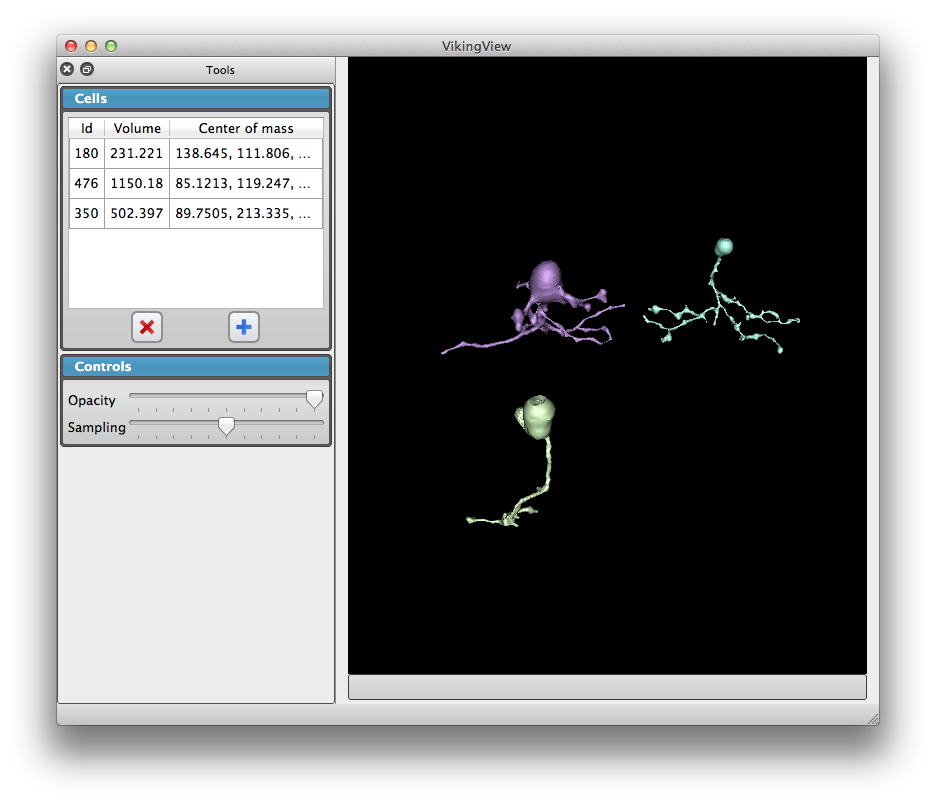 |
| neuron 3D visualizations | neuron 3D visualizations (rotated view) |